Cookie preferences
This website uses cookies, which are necessary for the technical operation of the website and are always set. Other cookies, which increase the comfort when using this website, are used for direct advertising or to facilitate interaction with other websites and social networks, are only set with your consent.
Configuration
Technically required
These cookies are necessary for the basic functions of the shop.
"Allow all cookies" cookie
"Decline all cookies" cookie
CSRF token
Cookie preferences
Currency change
Customer-specific caching
Individual prices
Selected shop
Session
Comfort functions
These cookies are used to make the shopping experience even more appealing, for example for the recognition of the visitor.
Note
Statistics & Tracking
Affiliate program
Google Analytics
Track device being used
- Order number: 37.19.0007.0
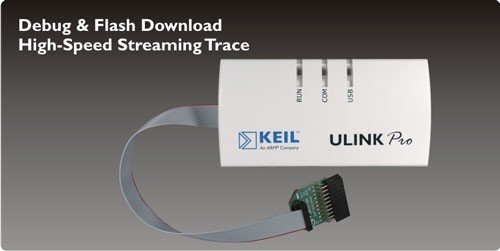
The Keil ULINK pro Debug and Trace Unit connects your PC's USB port to your target system... more
Product information "ULINKpro Debug and Trace Unit"
The Keil ULINKpro Debug and Trace Unit connects your PC's USB port to your target system (via a JTAG, Cortex Debug, or Cortex Debug+ETM connector). It allows you to program, debug, and analyze your applications using its unique streaming trace technology.
ULINKpro, together with MDK-ARM, provides extended on-the-fly debug capabilities for Cortex-M devices. You are able to control the processor, set breakpoints, and read/write memory contents, all while the processor is running at full speed. High-Speed data and instruction trace are streamed directly to your PC enabling you to analyze detailed program behaviour.
Features
- Supports ARM7, ARM9, Cortex-M0, Cortex-M1, Cortex-M3, and Cortex-M4 devices
- JTAG support for ARM7, ARM9, and Cortex-M
- Serial Wire Debug (SWD) support for Cortex-M
- Serial Wire Viewer (SWV) Data and Event Trace for Cortex-M up to 100Mbit/s (Manchester mode)
- Instruction Trace (ETM) for Cortex-M3 and Cortex-M4 up to 800Mbit/s
- Unique Streaming Trace direct to your PC, provides unlimited trace buffer
- JTAG Clock Speed up to 50MHz
- Supports Cortex-M devices running at up to 200MHz
- High-Speed Memory Read/Write up to 1MBytes/sec
- Seamless integration with the Keil µVision IDE & Debugger
- Wide target voltage range: 1.2V - 3.3V, 5V tolerant
- Support for 5V only devices using optional 5V Adapter
- Optional Isolation Adapter provides electrical isolation from the target system
- USB 2.0 High-Speed connection
- USB powered (no power supply required)
- Target Connectors
- 10-pin (0.05") - Cortex Debug Connector
- 20-pin (0.10") - ARM Standard JTAG Connector
- 20-pin (0.05") - Cortex Debug+ETM Connector
The unique streaming trace capabilities of ULINKpro delivers sophisticated analysis features such as:
- Complete Code Coverage information about your program's execution ensures thorough application testing and verification
- Performance Analysis using the Execution Profiler and Performance Analyzer enable you to identify program bottlenecks, optimize your application, and to isolate problems
- Streaming instruction trace requires the target device to have ETM (Embedded Trace Macrocell)
Related links to "ULINKpro Debug and Trace Unit"
Read, write and discuss reviews... more
Customer evaluation for "ULINKpro Debug and Trace Unit"
Write an evaluation
Evaluations will be activated after verification.
Hint!
Hint!
Viewed


