Diese Website benutzt Cookies, die für den technischen Betrieb der Website erforderlich sind und stets gesetzt werden. Andere Cookies, die den Komfort bei Benutzung dieser Website erhöhen, der Direktwerbung dienen oder die Interaktion mit anderen Websites und sozialen Netzwerken vereinfachen sollen, werden nur mit Ihrer Zustimmung gesetzt.
Konfiguration
Technisch erforderlich
Diese Cookies sind für die Grundfunktionen des Shops notwendig.
"Alle Cookies ablehnen" Cookie
"Alle Cookies annehmen" Cookie
Ausgewählter Shop
CSRF-Token
Cookie-Einstellungen
Individuelle Preise
Kundenspezifisches Caching
Session
Währungswechsel
Komfortfunktionen
Diese Cookies werden genutzt um das Einkaufserlebnis noch ansprechender zu gestalten, beispielsweise für die Wiedererkennung des Besuchers.
Produktinformationen "ULINKpro Debug and Trace Unit"
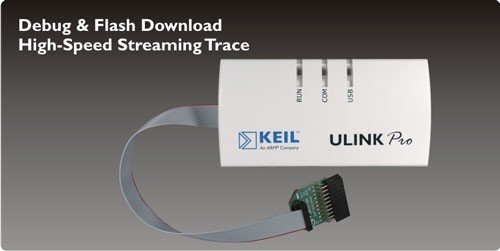
The Keil ULINKpro Debug and Trace Unit connects your PC's USB port to your target system (via a JTAG, Cortex Debug, or Cortex Debug+ETM connector). It allows you to program, debug, and analyze your applications using its unique streaming trace technology.
ULINKpro, together with MDK-ARM, provides extended on-the-fly debug capabilities for Cortex-M devices. You are able to control the processor, set breakpoints, and read/write memory contents, all while the processor is running at full speed. High-Speed data and instruction trace are streamed directly to your PC enabling you to analyze detailed program behaviour.
Features
Supports ARM7, ARM9, Cortex-M0, Cortex-M1, Cortex-M3, and Cortex-M4 devices
JTAG support for ARM7, ARM9, and Cortex-M
Serial Wire Debug (SWD) support for Cortex-M
Serial Wire Viewer (SWV) Data and Event Trace for Cortex-M up to 100Mbit/s (Manchester mode)
Instruction Trace (ETM) for Cortex-M3 and Cortex-M4 up to 800Mbit/s
Unique Streaming Trace direct to your PC, provides unlimited trace buffer
JTAG Clock Speed up to 50MHz
Supports Cortex-M devices running at up to 200MHz
High-Speed Memory Read/Write up to 1MBytes/sec
Seamless integration with the Keil µVision IDE & Debugger
Wide target voltage range: 1.2V - 3.3V, 5V tolerant
Support for 5V only devices using optional 5V Adapter
Optional Isolation Adapter provides electrical isolation from the target system
The unique streaming trace capabilities of ULINKpro delivers sophisticated analysis features such as:
Complete Code Coverage information about your program's execution ensures thorough application testing and verification
Performance Analysis using the Execution Profiler and Performance Analyzer enable you to identify program bottlenecks, optimize your application, and to isolate problems
Streaming instruction trace requires the target device to have ETM (Embedded Trace Macrocell)
Weiterführende Links zu "ULINKpro Debug and Trace Unit"
Diese Website benutzt Cookies, die für den technischen Betrieb der Website erforderlich sind und stets gesetzt werden. Andere Cookies, die den Komfort bei Benutzung dieser Website erhöhen, der Direktwerbung dienen oder die Interaktion mit anderen Websites und sozialen Netzwerken vereinfachen sollen, werden nur mit Ihrer Zustimmung gesetzt. Mehr Informationen